Solar vs Stocks
/ 8 min read
Updated:Table of Contents
This calculator helps you decide whether to invest in solar panels. It addresses two questions:
-
How much electricity will my system generate?
-
Is that electricity worth more than what I expect to make in the stock market (or some other investment)?
Step 1: Calculate Expected Electricity Generation
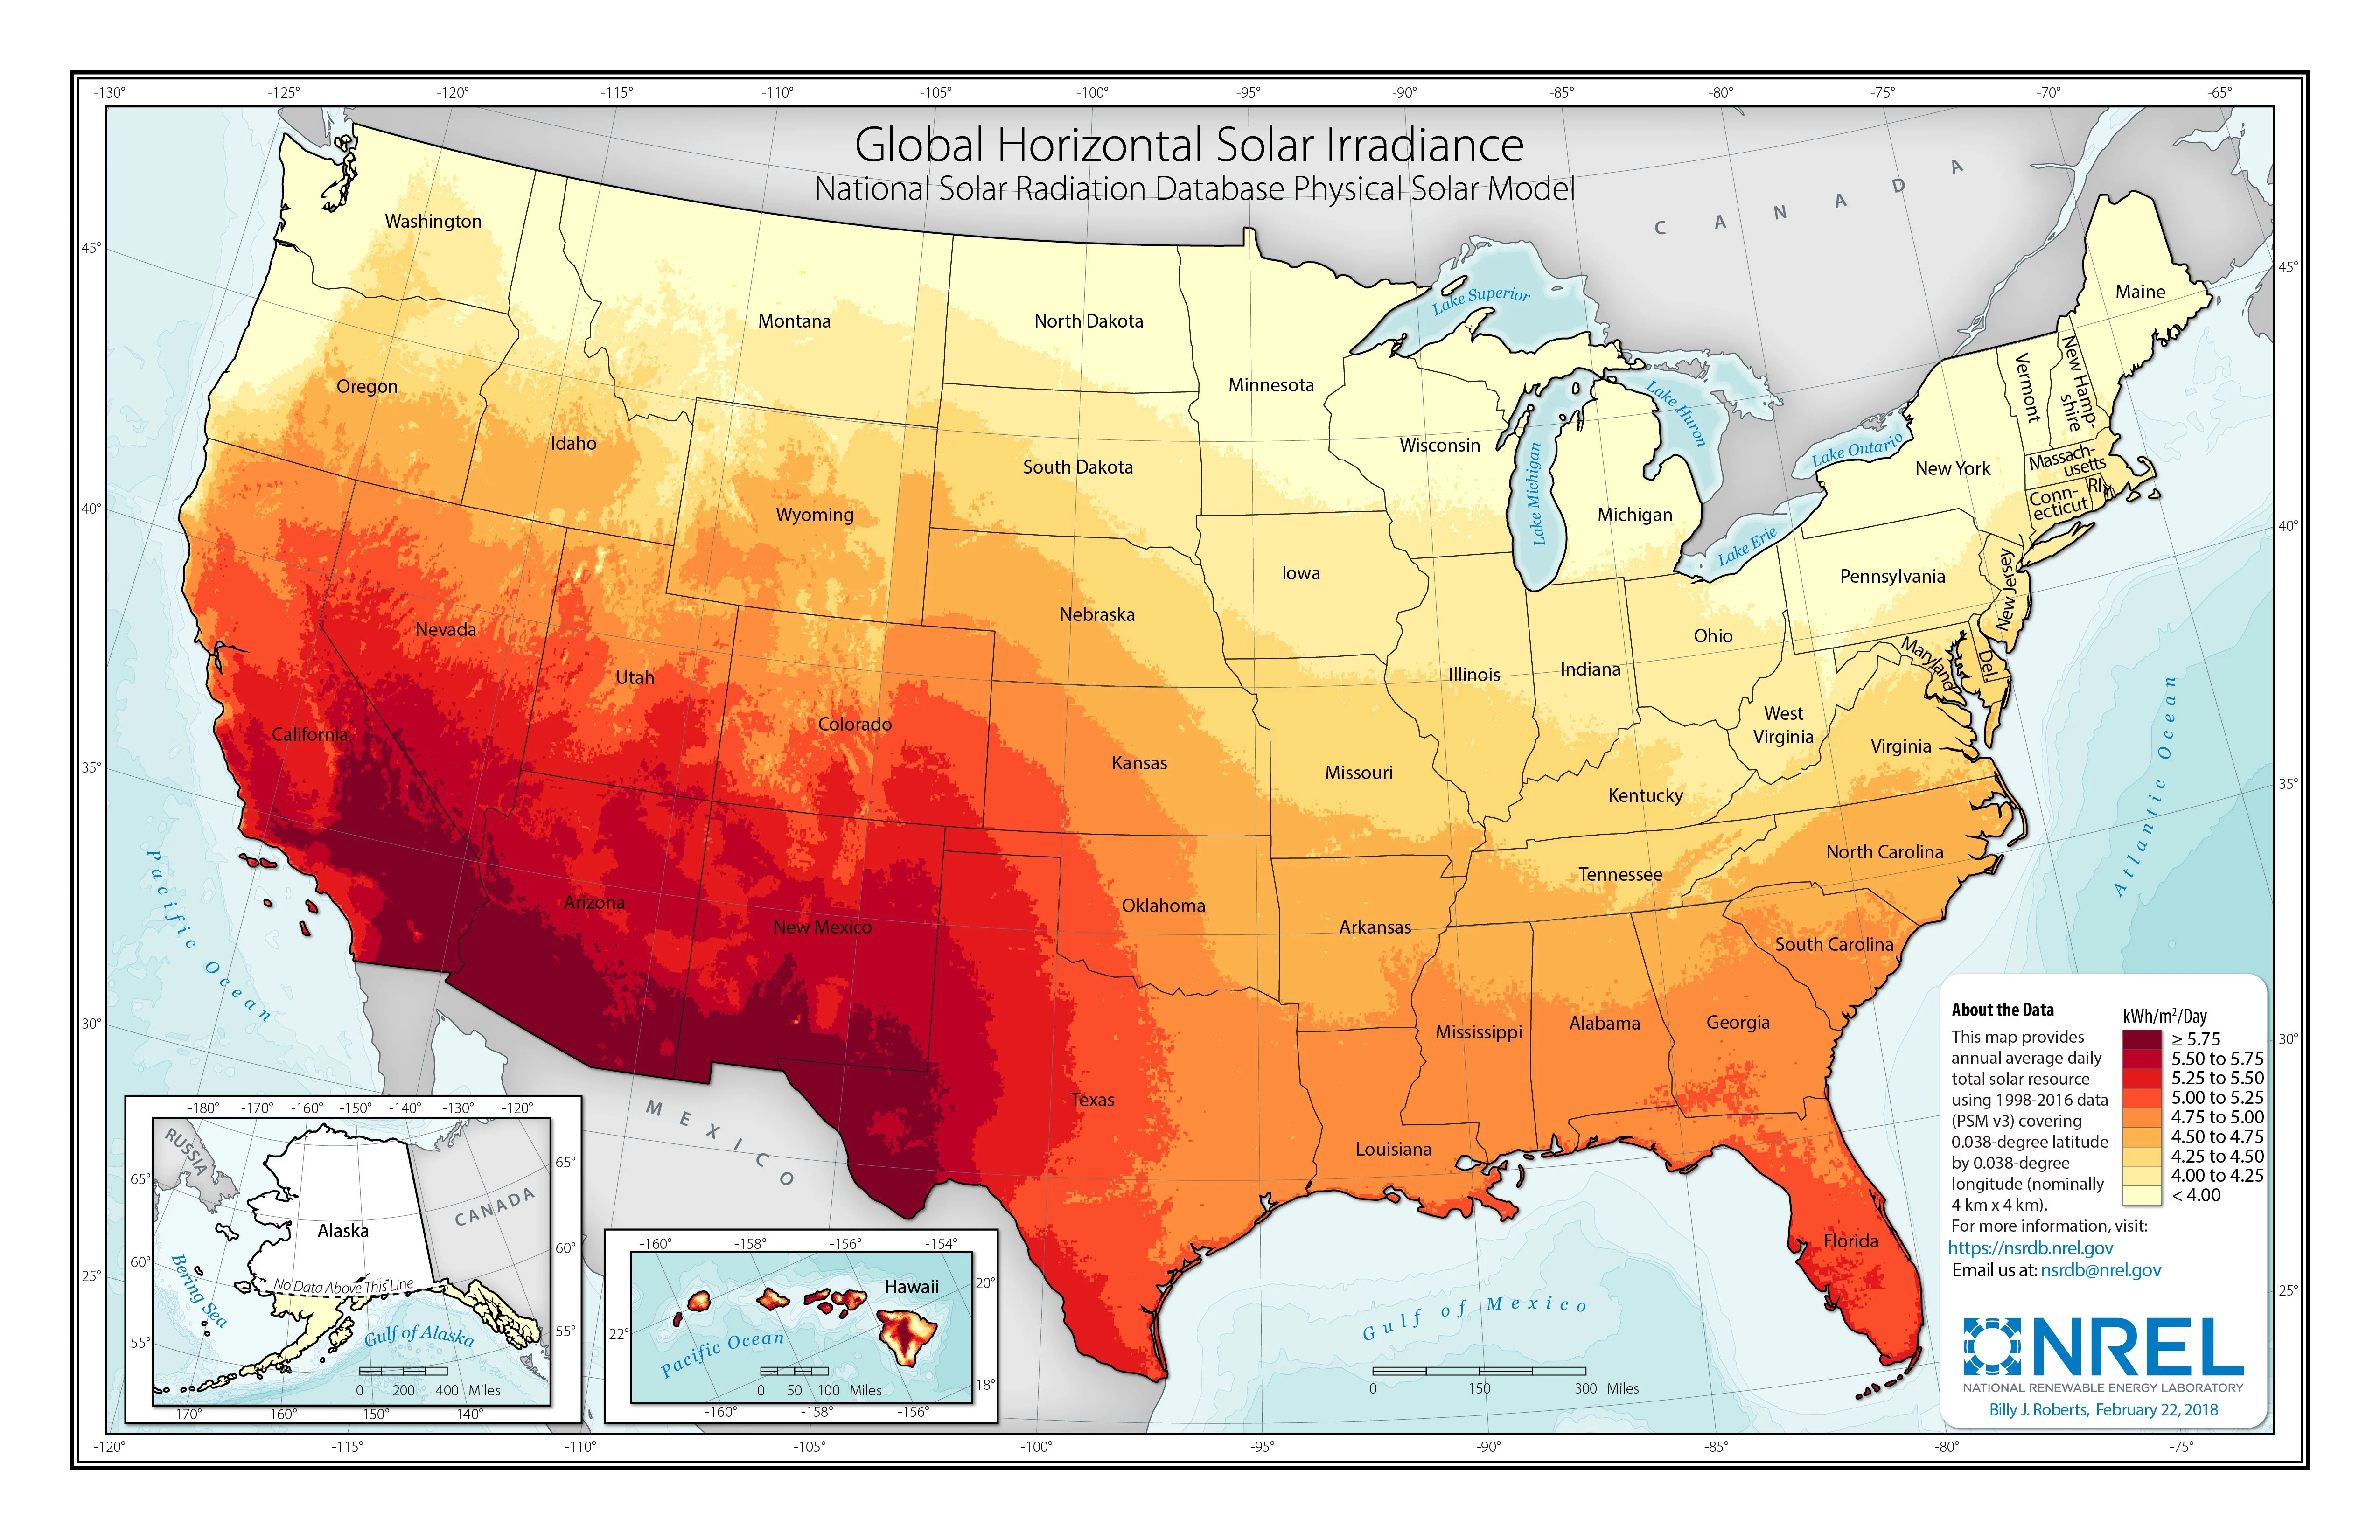
This calculator estimates how much electricity your solar system will produce annually. Where you live matters - folks in Maine receive about two-thirds the sunshine of Southern Arizona, as shown in the map below.
To estimate how much electricity your system will generate, we need three things:
- How much sun do you get?
- How big is your system?
- How efficient is your system?
| Variable | Value | Unit | Typical Range |
|---|---|---|---|
| Solar Radiation | kWh / m2 / day | 4 - 6 | |
| System Size | kW | 5 - 10 | |
| System Losses | % | 15 - 25 | |
| System Output | 0 | kWh / year |
For a more detailed estimate of electricity generation, check out NREL’s PVWatts Calculator.
Step 2: Compare Solar vs Stocks
Solar Strategy: You pay upfront for solar panels. Over time, you accumulate savings from not paying for electricity. The panels degrade slightly each year, producing less power, but electricity prices increase with inflation.
Stock Strategy: Instead of investing in solar panels, you invest the same amount in the stock market, earning average returns. However, you still need to pay for electricity each year, which comes out of your investment balance.
This HomeGuide page has some useful ballpark numbers for how much solar systems cost by size.
| Variable | Value | Unit | Typical Range |
|---|---|---|---|
| Initial Investment | $ | 15,000 - 30,000 | |
| Electricity Generated Year 1 | kWh | 8,000 - 12,000 | |
| Solar Panel Degradation Rate | % / year | 0.5 - 1.0 | |
| Cost of Electricity Year 1 | $ / kWh | 0.10 - 0.25 | |
| Electricity Inflation Rate | % / year | 2 - 5 | |
| Expected Stock Market Return | % / year | 7 - 10 |
Assuming the system runs perfectly, here is how things stand after thirty years:
| Metric | Value |
|---|---|
| Total Electricity Produced | 0 kWh |
| Total Electricity Value | $0 |
| Solar Internal Rate of Return (IRR) | 0% |
| Solar Net Present Value (NPV) | $0 |
| Total Stock Returns | $0 |
| Stocks at Year 30 | $0 |